
客户端操作:
1,查看nginx 是否编译的有--with-http_stub_status_module模块
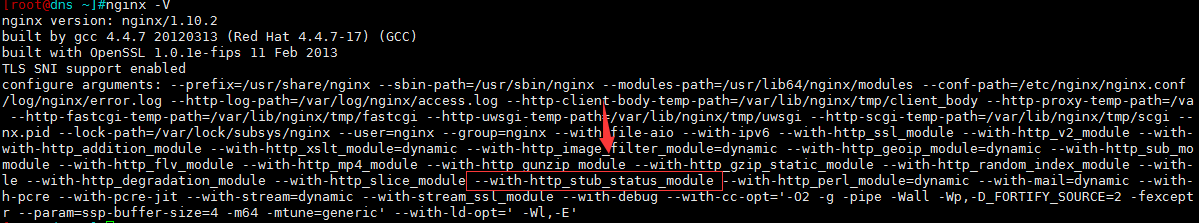
zabbix 是根据这个模块内容来监控数据的,如果没有的话,百度搜索 nginx添加模块 来添加此模块!
2,nginx 打开 status :
mkdir -p /usr/share/nginx/html/status
在你的server 中加入:
server {
     ......
     location = /status {
         stub_status on;
         access_log off;
         allow 192.168.1.100;
         allow 允许访问的IP地址;
         deny all;
        }
}
3,保存重启nginx,访问测试:

参数意思:
active connections – 当前 Nginx 正处理的活动连接数。
serveraccepts handled requests — 总共处理了 11 个连接 , 成功创建 11 次握手 (证明中间没有失败的 ), 总共处理了 13 个请求。
reading — nginx 读取到客户端的 Header 信息数。
writing — nginx 返回给客户端的 Header 信息数。
waiting — 开启 keep-alive 的情况下,这个值等于 active – (reading + writing), 意思就是 Nginx 已经处理完正在等候下一次请求指令的驻留连接。
如果出现403情况,允许ip中添加上你主机的ip。
4,编写脚本-修改配置
4.1  编写脚本
mkdir -p /etc/zabbix/script
cd /etc/zabbix/script/
vim nginx-check.sh

#!/bin/bash
##################################
# Zabbix monitoring script
#
# nginx:
# - anything available via nginx stub-status module
#
##################################
# Contact:
# vincent.viallet@gmail.com
# Zabbix requested parameter
ZBX_REQ_DATA="$1"
ZBX_REQ_DATA_URL="$2"
# Nginx defaults
NGINX_STATUS_DEFAULT_URL="http://www.test.com/status"    #(这里写网站的域名)
WGET_BIN="/usr/bin/wget"
#
# Error handling:
# - need to be displayable in Zabbix (avoid NOT_SUPPORTED)
# - items need to be of type "float" (allow negative + float)
#
ERROR_NO_ACCESS_FILE="-0.9900"
ERROR_NO_ACCESS="-0.9901"
ERROR_WRONG_PARAM="-0.9902"
ERROR_DATA="-0.9903" # either can not connect / bad host / bad port
# Handle host and port if non-default
if [ ! -z "$ZBX_REQ_DATA_URL" ]; then
 URL="$ZBX_REQ_DATA_URL"
else
 URL="$NGINX_STATUS_DEFAULT_URL"
fi
# save the nginx stats in a variable for future parsing
NGINX_STATS=$($WGET_BIN -q $URL -O - 2> /dev/null)
# error during retrieve
if [ $? -ne 0 -o -z "$NGINX_STATS" ]; then
 echo $ERROR_DATA
 exit 1
fi
#
# Extract data from nginx stats
#
case $ZBX_REQ_DATA in
 active_connections) echo "$NGINX_STATS" | head -1 | cut -f3 -d' ';;
 accepted_connections) echo "$NGINX_STATS" | grep -Ev '[a-zA-Z]' | cut -f2 -d' ';;
 handled_connections) echo "$NGINX_STATS" | grep -Ev '[a-zA-Z]' | cut -f3 -d' ';;
 handled_requests) echo "$NGINX_STATS" | grep -Ev '[a-zA-Z]' | cut -f4 -d' ';;
 reading) echo "$NGINX_STATS" | tail -1 | cut -f2 -d' ';;
 writing) echo "$NGINX_STATS" | tail -1 | cut -f4 -d' ';;
 waiting) echo "$NGINX_STATS" | tail -1 | cut -f6 -d' ';;
 *) echo $ERROR_WRONG_PARAM; exit 1;;
esac
exit 0

给予执行权限:
chmod +x nginx-check.sh

4.2
更改配置文件:
vim /etc/zabbix/etc/zabbix_agentd.conf
Include=/etc/zabbix/etc/zabbix_agentd.conf.d/  #开启此项(路径修改你自己的路径)

4.3
自定义key:
cd /etc/zabbix/etc/zabbix-agentd.conf.d/
vim nginx-params.conf
UserParameter=nginx[*],/etc/zabbix/scripts/nginx-check.sh "$1"   #此处路径填写你脚本位置路径
5,重启 agentd服务
/etc/init.d/zabbix_agentd restart
服务端操作:
6,在server端测试
[root@zabbix-server ~]# zabbix_get -s 192.168.1.100 -p 10050 -k "nginx[reading]"
ZBX_NOTSUPPORTED: Unsupported item key.

如果报这个错了,不识别这个自定义的key!

解决:
修改客户端配置文件:
vim /etc/zabbix/etc/zabbix_agentd.conf
UnsafeUserParameters=1  #去掉注释,修改值为 1

保存重启agentd服务
/etc/init.d/zabbix_agentd restart

再在server 测试:
[root@zabbix-server ~]# zabbix_get -s 192.168.1.100 -p 10050 -k "nginx[reading]"
0
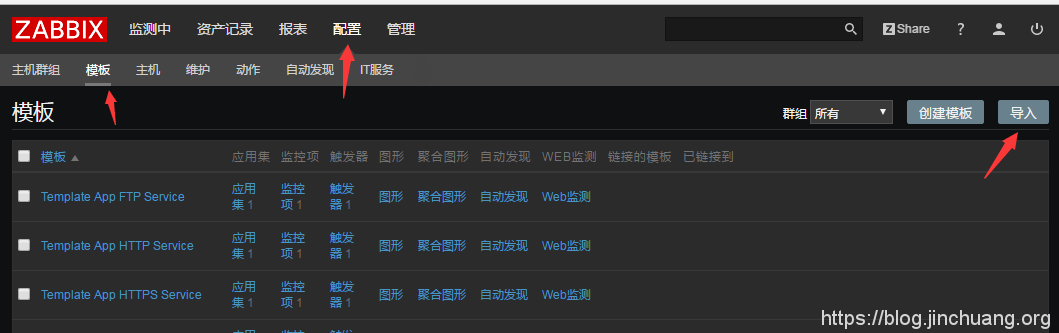
7,web 端界面操作:
nginx-template模板下载:nginx-template
添加导入模板

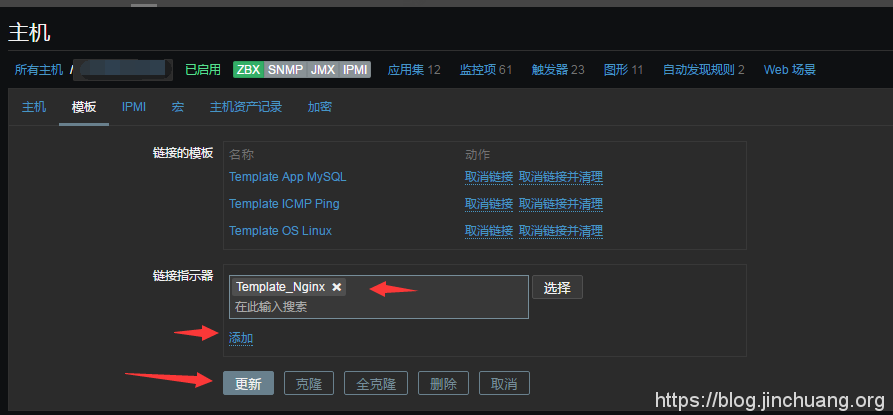
模板链接到主机
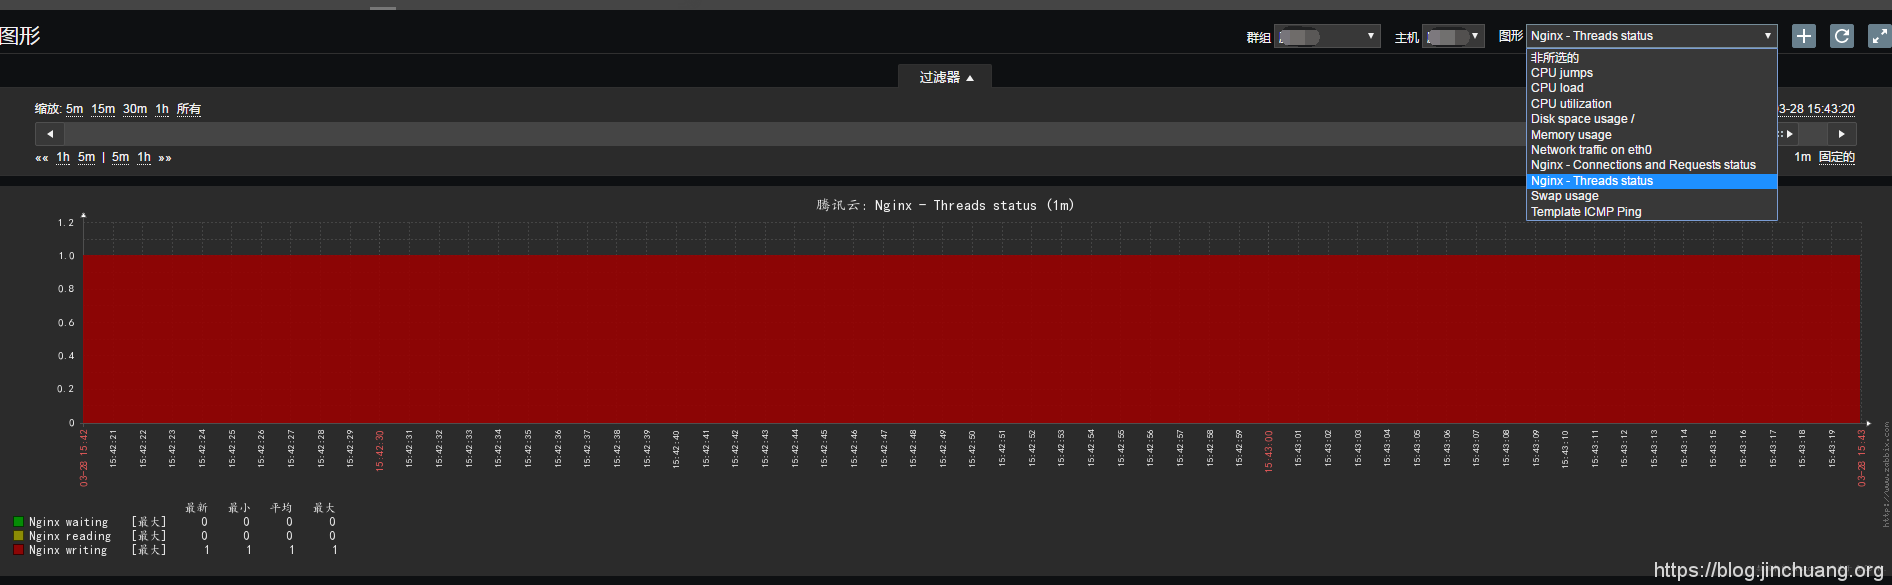
等待一段时间查看图形数据:
参考的文章:
http://68686789.blog.51cto.com/10438688/1892414
https://www.phpsong.com/2063.html